Popularity of Various Data Analytic Tools at AIR Forums
Data: It’s become a cliche to say that it’s everywhere and in quantities that are unimaginable. But data in its raw form, whether in a structured database or on the internet, is of limited use until a human does something to it: Gather it, clean it, visualize it, model it, write about it, and so-on.
The amount of data that those in institutional research encounter requires powerful tools to work with. And those tools exist. Lots of them. Everything from free, open-source software, to software costing hundreds of thousands dollars offered by companies that won’t stop emailing you despite unsubscribing from their list on a weekly basis.
On the rare occasion someone asks me which software I’d recommend, I always say R. In my experience, its ability to do everything you’d want and need to do as an institutional researcher is unmatched (cut to five minutes later when that someone regrets having asked me and is looking for ways to exit the conversation). But rather than use this space to drone on about why I think R is amazing, my goal here is to reveal the software preferences of others in the field. (And obviously, I used R to do this!)
It’s not a perfect approach, but my thinking was I could see how often different tools were mentioned in AIR Forum program books and how that’s changed over time. My first step was to download the program books from the forum website going back six years. Next, I created a function to read each of the programs books into R and tidy them so every individual word within each book is contained on its own line in a single data frame.
# load packages
library(pdftools)
library(tidyverse)
library(tidytext)
library(scales)

# function to read in PDFs and get one word per line.
text_prepr <- function(doc, forum_year){

  reg <- "([^A-Za-z\\d#@']|'(?![A-Za-z\\d#@]))"

  df <- pdf_text(doc)

  df <- data.frame(df)

  df <- df %>%
    rename(text = df) %>%
    unnest_tokens(word, text,  token = "regex", pattern = reg) %>%
    mutate(year = forum_year)

  return(df)
}

# apply function to programs books
all_years <- bind_rows(
  text_prepr("data/AIR-2018-Forum-Program-Book.pdf", 2018),
  text_prepr("data/2017-AIR-Forum-Program-Book.pdf", 2017),
  text_prepr("data/2016_AIR-Forum_Program-Book.pdf", 2016),
  text_prepr("data/2015-Forum-Program-Book-Web.pdf", 2015),
  text_prepr("data/2014ForumProgramBookFinal.pdf", 2014),
  text_prepr("data/2013finalprogram.pdf", 2013)
)
This resulted in a data frame with a total 447582 rows (one row for each word), a glimpse of which is printed below:
head(all_years)## word year
## 1 association 2018
## 2 for 2018
## 3 institutional 2018
## 4 research 2018
## 5 2018 2018
## 6 may 2018Next, I decided on which words I would ask R to look for. Somewhat arbitrarily and somewhat based on my experience at AIR Forums, I chose the following: Excel, R, SAS, SPSS, and Tableau. The code below (1) searches for mentions of those tools in the list of words created above (2) counts the results by year (3) builds a chart of the results. To clarify, the resulting chart displays the number of times each software is mentioned in each of the AIR Forum program books for each of the respective years.
# filter for keywords and count by word and year
software <- all_years %>%
  mutate(word = tolower(word)) %>%
  filter(word %in% c("excel", "r", "sas", "spss", "tableau")) %>%
  count(word, year) %>%
  complete(word, year, fill = list(n = 0))

# make data frame of only 2018, so can include as labels at end of lines
software_2018 <- software %>%
  filter(year == 2018)

# create chart
ggplot() +
  geom_line(data = software, aes(x = year, y = n, color = word, group = word), size = 2) +
  geom_text(data = software_2018, aes(x = year, y = n, label = word), nudge_y = 2) +
  geom_point(data = software, aes(x = year, y = n, color = word), size = 3) +
  theme_minimal() +
  labs(x = "Forum Year", y = "# of Mentions",
       title = "Number of Times Software is Mentioned in AIR Forum Program Book",
       subtitle = "2013 to 2018 Forums") +
  guides(color = FALSE)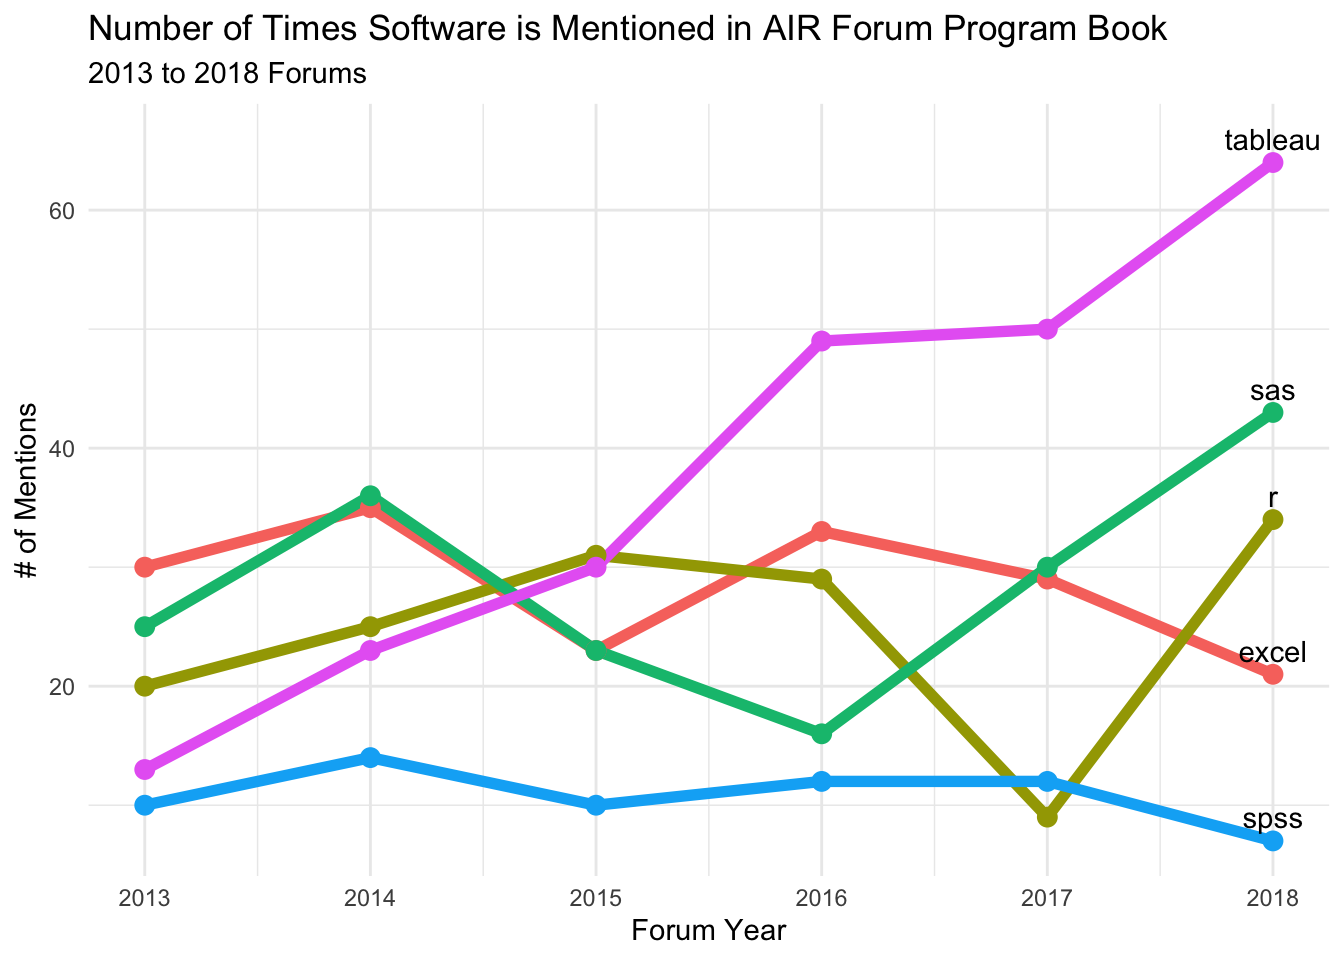
What stands out - and confirms what I’ve noticed at AIR Forums - is the rapid rise of Tableau. In 2014 I had never heard of it. In 2018, not knowing at least something about it seems unavoidable. Tableau is known for visual analytics, so it’s not surprising that its rise in populairty has coincided with an increasing interest in data visualization at AIR Forums.
# filter for keyword and count by word and year
visualize <- all_years %>%
  group_by(year) %>%
  mutate(total = n()) %>%
  ungroup() %>%
  mutate(visualiz = str_detect(word, "visualiz")) %>%
  group_by(year) %>%
  summarise(prop = mean(visualiz)) %>%
  ungroup()


# create chart
ggplot(visualize, aes(x = year, y = prop)) +
  geom_line(size = 2) +
  geom_point(size = 3) +
  theme_minimal() +
  labs(x = "Forum Year", y = "% of Mentions",
       title = 'Percent of All Words That Were "Visualiz*" in AIR Forum Program Book',
       subtitle = "2013 to 2018 Forums") +
  guides(color = FALSE) +
  scale_y_continuous(label = percent_format())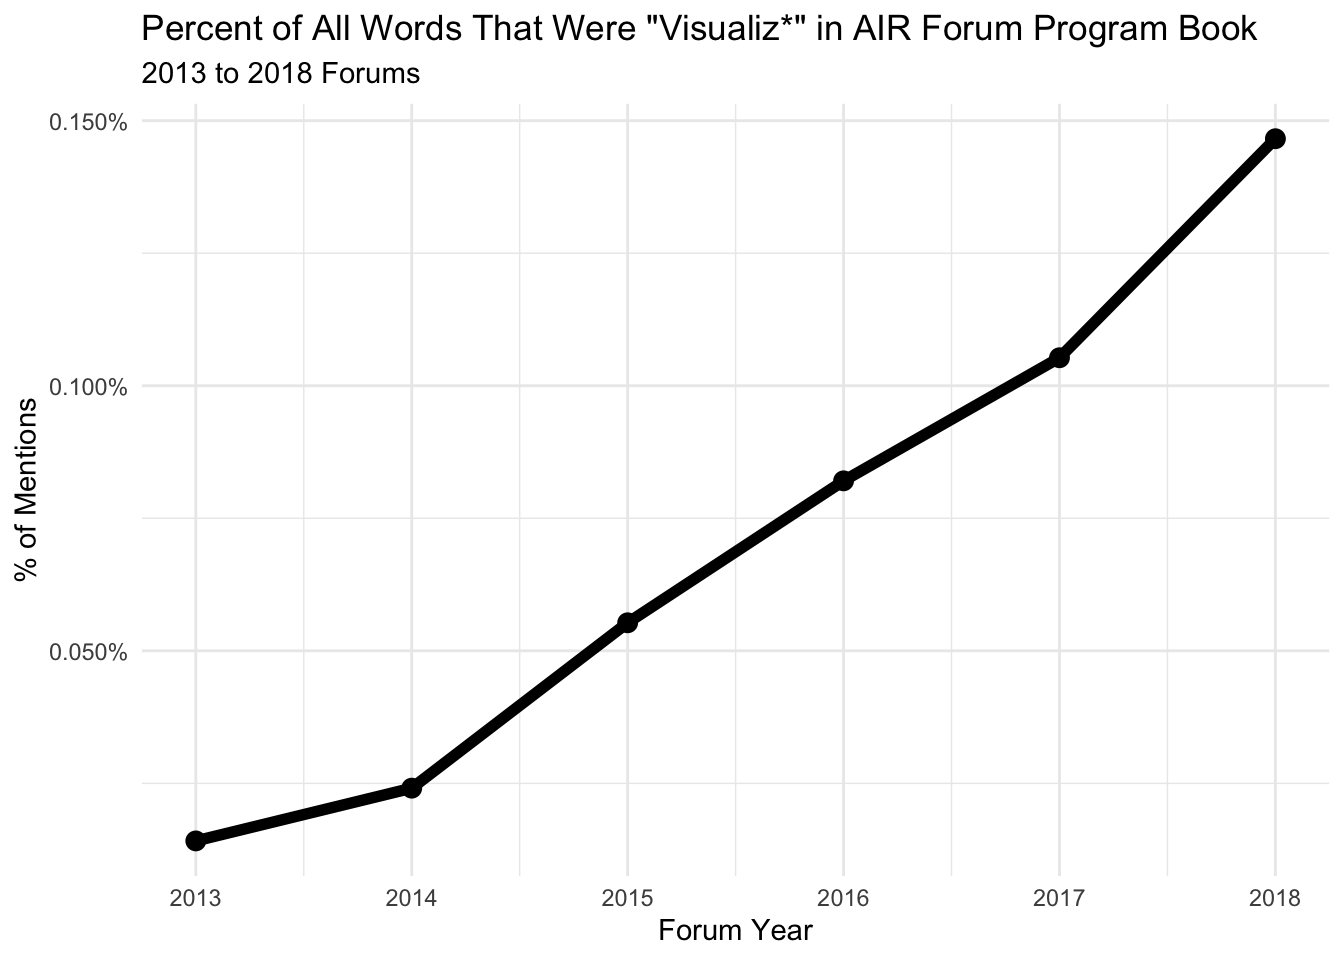
Returning to the first chart, perhaps it’s my background in psychology - a field which has historically been dominated by SPSS - but I was surprised how little SPSS is mentioned (although, I wouldn’t be surprised to see it decrease in the future). As for R, it seems to have a presence, but I’m curious to see what happens to its popularity in institutional research over the next few years. Judging by my experience at recent Forums and the development of R tools that decrease the barrier to entry, my prediction is that interest will only grow.
I’m not sure if this need be said, but I will: This approach to evaluating software popularity is fraught with limitations. My goal, however, was not to get a precise estimate. Rather, I was interested in one, getting a general sense of broad trends, and two, sharing how just a little of bit R code can do so much!