An Analysis of Gender Disparity Among Higher Education Chief Administrators
The chief administrator job of a higher education institution is, as the title implies, the pinnacle of careers in academic administration. The chief administrator is a school’s spokesperson and guides its vision, affecting the lives of the thousands of students who pass through those institutions. And for the chief administrators who don’t care about the idealism of educating future generations, I would imagine the high-six/low-seven figure salaries that many earn is incentive enough. Despite the prominent roles that these administrators fill, there is a dearth of publicly available data on them.
Every institution that participates in federal student financial aid is required to submit data to Integrated Postsecondary Education System, or IPEDS. Eventually, the submitted data is made publicly available in the IPEDS Data Center. This includes numbers on admissions, student enrollment, degree completions, graduation rates, financial aid, finances, human resources, and libraries. Much of this data has to be reported by gender and race/ethnicity. For example, how many Hispanic female undergraduates began at an institution last fall? What is the graduation rate of male American Indian Alaska Natives? What is the average salary of female instructional staff on a 9-month contract? But for one reason or another, as far as I can tell, the only things that must be reported about an institution’s chief administrator are her or his name and title.
Names, though, are not completely devoid of meaningful information. If you live in the United States and hear the name Steven, you probably think of a male, and if you hear the name Mary, you probably think of a female. Yes, some names are more ambiguous than others (my own being a good example), and some people’s names might belie the gender they identify with, but there is a degree of reliability that a person’s name offers in determining whether they are female or male. Thus, using first names to make educated guesses about chief administrators’ gender, my goal here was to describe gender representation among this set of individuals.
The first step was to download the names of the chief administrators for every institution in the IPEDS Data Center (n = 7108) and clean up the data. This required putting years in a consistent format; removing titles preceding first names (e.g., Dr., Ms., Mrs.); extracting first names into their own column; and adding variable labels for college sector.
library(tidyverse)
library(babynames)
library(scales)

admin <- read_csv("data/chief-admin-names.csv")
# tidy year
admin <- admin %>%
gather("year", "name", `Name of chief administrator (HD2016)`,
`Name of chief administrator (HD2015)`:`Name of Chief Administrator (IC90HD)`)
# extract year from names and put in consistent format
admin <- admin %>%
mutate(year = parse_number(year),
year = ifelse(year >= 9596 & year <= 9798,
str_sub(start = 1, end = 2, year), year),
year = ifelse(nchar(year) == 2,
paste0("19", year),
year),
year = as.integer(year))
# select and rename variables
admin <- admin %>%
select(unit_id = UnitID,
sector_code = `Sector of institution (HD2016)`,
institution_name = `Institution Name`,
year, name,
undergrad_enroll_2016 = `Grand total (EF2016 All students Undergraduate total)`,
grad_enroll_2016 = `Grand total (EF2016 All students Graduate and First professional)`)
# titles are in the first position for many names, so need to remove
# those so can extract first posistion from names and have it reflect
# first name
admin <- admin %>%
mutate(name = tolower(name),
name = gsub("\\.", "", name),
name = gsub("\\<dr\\>", "", name),
name = gsub("\\<mr\\>", "", name),
name = gsub("\\<ms\\>", "", name),
name = gsub("\\<mrs\\>", "", name),
name = gsub("\\<rev\\>", "", name),
name = gsub("\\<reverend\\>", "", name),
name = gsub("\\<very reverend\\>", "", name),
name = gsub("\\<very\\>", "", name),
name = gsub("\\<rabbi\\>", "", name),
name = gsub("\\<msgr\\>", "", name),
name = gsub("\\<dra\\>", "", name),
name = gsub("\\<sr\\>", "", name),
name = str_trim(name, side = "both"),
full_name = tolower(name)) %>%
separate(name, into = "first_name", sep = " ")
# add sector label
labels <- read_csv("data/sector-value-labels.csv") %>%
select(sector_code = Value,
sector_label = ValueLabel)
admin <- left_join(admin, labels, by = "sector_code")Next, I assigned a gender to each chief administrator based on her or his first name. To do this, I used R’s babynames package, which contains the number of babies born every year from 1880 to 2015 for each combination of name and sex1. I took the babynames data and calculated how often each name was given to females vs. males, and then assigned gender based on the higher proportion. For example, in the babynames data, about 72% of all newborns named Jaydin were male, so I assigned the name Jaydin to male. Names like Jaydin, however, were the exception: Most of the time, names went overwhelmingly to one sex or the other, with the vast majority of names in the babynames dataset being associated with only one sex.
# read in babynames data and assign a proportion to female and male for each name
baby_names <- babynames %>%
  select(sex, name, n) %>%
  mutate(name = tolower(name))

baby_names <- baby_names %>%
  group_by(sex, name) %>%
  summarise(total = sum(n)) %>%
  ungroup() %>%
  group_by(name) %>%
  mutate(prop = total/sum(total)) %>%
  filter(prop == max(prop)) %>%
  ungroup() %>%
  select(sex, first_name = name, prop)

# one chief admin officer has name gold and it happens to be one that is .5 prop,
# so removed from dataset. (gold was given as full name, so i'm *guessing* this
# is actually last name).
baby_names <- baby_names %>%
  filter(first_name != "gold" | prop != .5)
Historical Trends
This gave me a “dictionary” containing the probabilistic sex of 97,430 first names, which I then linked to the chief administrator data2, making it possible to examine historical trends in gender differences among chief administrators. (The babynames data is based on sex, but once I link it to adults’ names (i.e., the administrators), I make the (often wrong) assumption that names reflect gender. Also, of course, with this data, it is not possible to account for gender non-binary administrators).
# join ipeds and babynames, removing rows where there were no matches
admin <- left_join(admin, baby_names, by = "first_name") %>%
  mutate(institution_name = gsub("-", " ", institution_name)) %>%
  filter(!is.na(sex))

admin <- admin %>%
  select(unit_id, institution_name, sector_label, year, undergrad_enroll_2016,
         grad_enroll_2016, full_name, first_name, sex)

# several variables are for 2016 only, so put those in their own data frame
admin_2016 <- admin %>%
  filter(year == 2016) %>%
  select(-year)

admin <- admin %>%
  select(-undergrad_enroll_2016, -grad_enroll_2016)

# proportion female by year
female_prop_sex <- admin %>%
  count(year, sex) %>%
  group_by(year) %>%
  mutate(year_total = sum(n)) %>%
  ungroup() %>%
  mutate(prop_sex = n/year_total) %>%
  filter(sex == "F")

female_prop_sex %>%
  ggplot(aes(x = factor(year), y = prop_sex, group = 1)) +
  geom_line() +
  geom_point() +
  theme_minimal() +
  theme(axis.text.x = element_text(angle = 90, vjust = 0.5, hjust=1)) +
  scale_y_continuous(label = percent_format()) +
  labs(x = "Year", y = "Percent Women",
       title = "Percentage of Chief Administrators Who Are Women",
       subtitle = "All IPEDS Institutions, Years 1990-2016")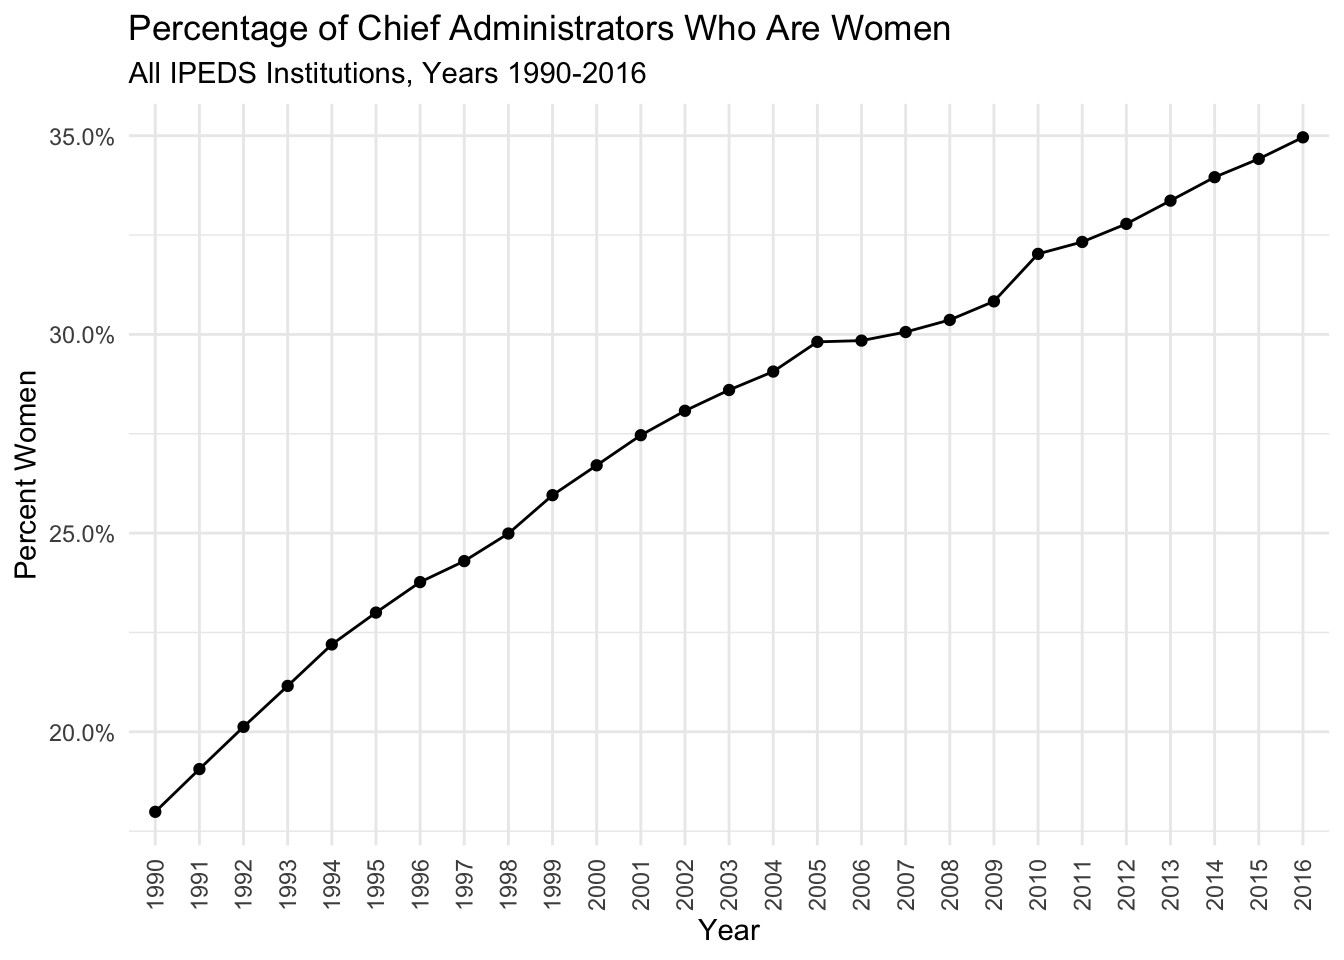
There are three things to notice about the chart:
- The increasing percentage of chief administrators who are women3.
- The still minority percentage of chief administrators who are women
- The 35% figure I came up with for 2016 is roughly consistent with a survey reporting that 30% of 2016 college presidents were women), and compatible with the trends reported here, lending some support to the approach I selected.
Institution Type
School, as it’s used in IPEDS, is a broad term that covers vastly different types of institutions. It includes everything from a cosmetology school that enrolls a handful of students each year to flagship schools with billion-plus endowments and tens of thousands of students. That is to say, chief administrator positions vary in prestige, responsibility, salary, and a host of other intangibles. With that in mind, I calculated the percentage of female chief administrators, by sector.
# proportion female by sector
female_by_sector <- admin_2016 %>%
  count(sector_label, sex) %>%
  group_by(sector_label) %>%
  mutate(prop_sex = n/sum(n)) %>%
  ungroup() %>%
  filter(sex == "F")

female_by_sector %>%
  ggplot(aes(x = reorder(sector_label, prop_sex), y = prop_sex)) +
  geom_col() +
  coord_flip() +
  scale_y_continuous(label = percent_format()) +
  theme_minimal() +
  labs(x = NULL, y = "Percent Women",
       title = "Percentage of Chief Aministrators Who Are Women,\nby Sector",
       subtitle = "All IPEDS Institutions, Year 2016")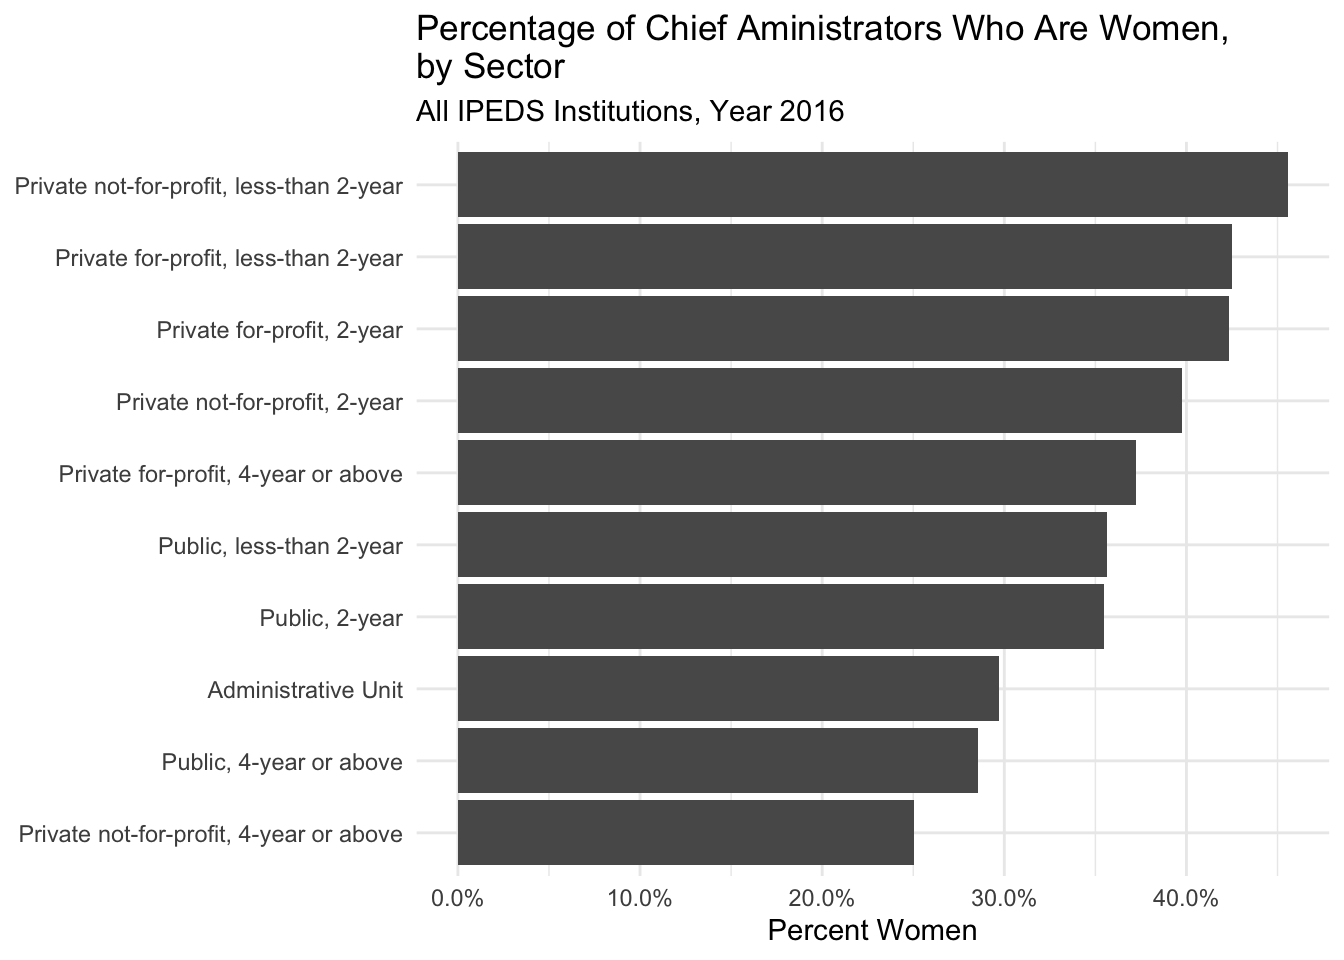
Although they are a minority in every sector, women make up a higher percentage of chief administrators at 2-year schools than at 4-year schools. One institution type is not better than another, but they serve different functions (e.g., teaching vs. research), meaning the disparities by sector further exaggerate the existing imbalance. For example, in 2016, 35% of academic chief administrators were women, yet the institutions they led accounted for only 29% of all students enrolled at institutions of higher education.
Conclusion
The overall trend is moving in the right direction, but change is slow: From 1990 to 2016, the average yearly increase in the percentage of women chief administrators was 1%. These are prestigious jobs that aren’t vacated haphazardly, so for the near-term, the disparity is here to stay: If the same rate of change observed from 1990 to 2016 continues, it will take 23 years until gender parity among chief administrators is achieved.
This is of course not a problem unique to higher education, but a societal one that begins well before women submit job applications. We must be aware of our biases - stop always telling your niece that she is pretty and her brother that he is smart! - however subtle they are, and correct them. You don’t have to be a woman to care about this, after all, “human rights are women’s rights”.
The data is restricted to combinations of five for more.↩
I removed rows where there were no matches between first names in the IPEDS data and first names in the babynames data.↩
You may have noticed a slight dip from 2006 to 2009. Considering how abrupt it is, I’m skeptical it represents a real trend. My guess is that it is instead reflective of an unrelated change in the underlying data (e.g., different reporting requirements), but I’m not entirely sure.↩