A Brief History of NBA Three-Point Attempts: 1998 to 2018 Seasons
On October 29, 2018, in a game against the Chicago Bulls, Klay Thompson attempted 24 three-pointers, making 14 of them; both marks set NBA records. A couple months after that his teammate Stephen Curry attempted 14 three pointers in a single half of a single NBA game, which tied an NBA record. That same game, the Golden State Warriors and Sacramento Kings made a combined 41 threes, a total that had never been reached before. Just this morning when I checked ESPN.com I learned that the previous night James Harden scored 61 points in Madison Square Garden, but maybe more shocking, he did it while attempting 20 three-point shots (he only made five of them).
For anyone who has been paying attention to the NBA for more than a few years, these numbers look like typos. The NBA began using the three-point line in 1979, and on October 12 of that year - almost 40 years ago - Chris Ford made the first one. For most of its history the three-point shot has been like that kitchen gadget you’ve always had but rarely used until someone showed you what a powerful tool it could be (immersion blender maybe?).
_(Chris_Ford_crop).jpg)
In the case of the NBA, that someone would be Houston Rockets General Manager Daryl Morey, who wisely drew attention to math and the reality that three is worth more than two. More specifically, his insight was that the shots most worth taking are higher percentage attempts near the basket (layups and dunks, ideally), or lower percentage ones that are further from the basket but are worth three points (free throws are also an important part of the equation in so-called Morey-Ball). This means that if a team’s goal is to get the most points out of every position (and that is every team’s goal), mid-range shots should be discouraged: They are harder to make than layups and dunks and still worth only two points.
This has had a profound effect on how games are played and which players are valued. It wasn’t long ago that big men were expected to be able to post up near the basket and wouldn’t have to think about life outside the three-point arc. In 2019, a few games past the midpoint of the current season, Brook Lopez has already attempted 304 threes, Karl-Anthony Towns attempted 217, Marc Gasol attempted 193, Joel Embid attempted 178. Each of these players is listed as a center and is at least 7’0 feet tall. And the list goes on.
And it’s not just who is shooting threes, it’s how they’re being shot. James Harden is setting new records for the number of unassisted threes made, meaning he doesn’t just shoot from deep as a compromise when better shots are not available, but it’s as if any shot that is not a three is a compromise. Or consider Curry, for whom the three-point line itself is merely a suggestion; he has made 45 of 94 threes (47.9%!) launched from between 30 and 35 feet since 2014-2015 (the line is 23 ft 9 inches from the basket, and 22 feet if you are standing in the corner).
In 2019, you don’t have to watch games closely to notice the abundance of three pointers that are being shot. But still, I wanted to attach some numbers to the obvious, so below, I present a brief quantitative history of NBA three-point attempts.
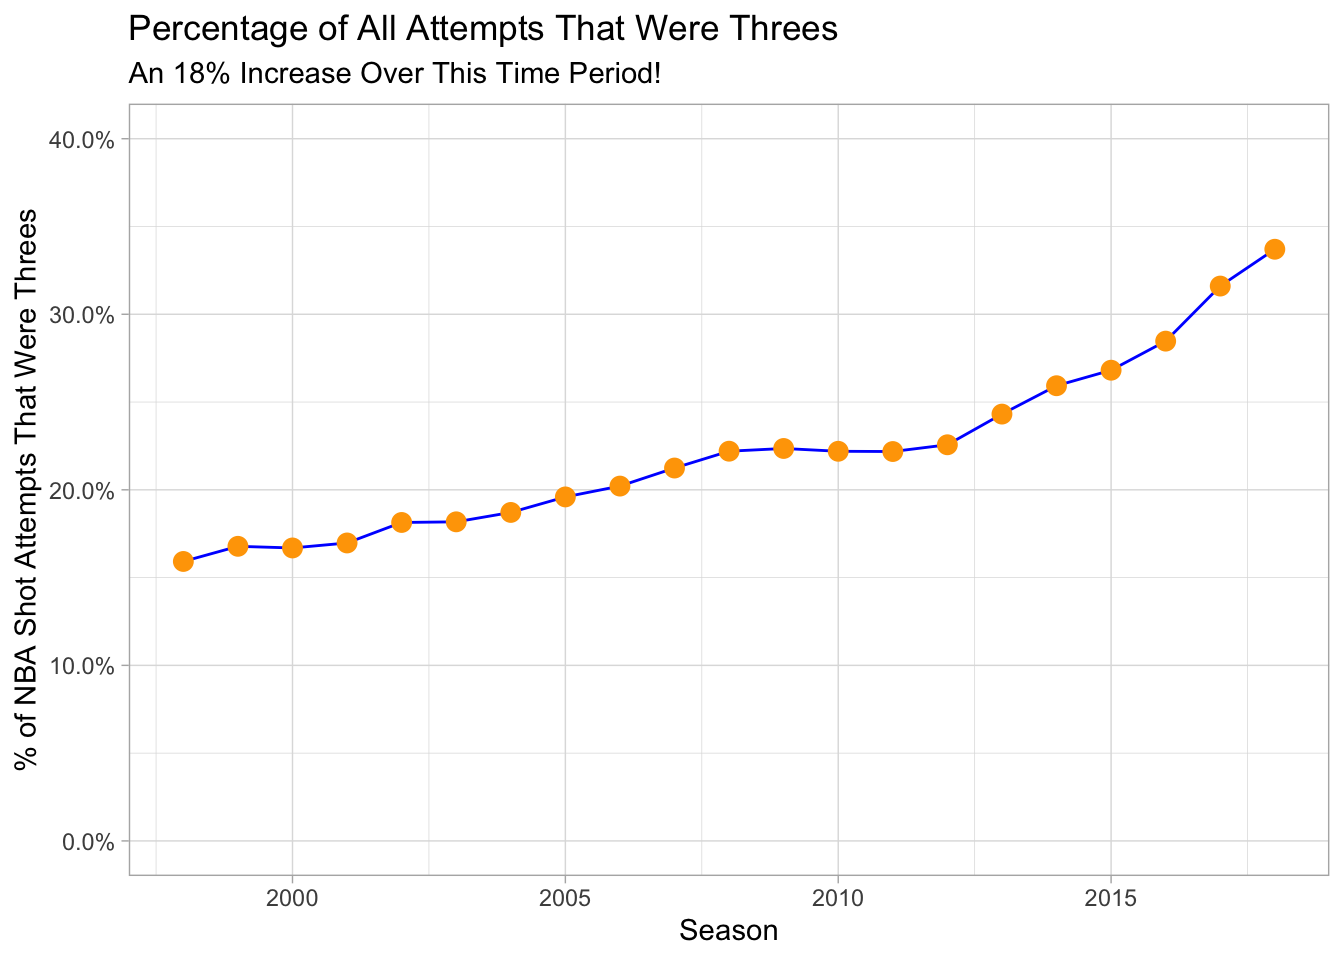
Percentage of All Shot Attempts That Were Threes
It’s easy to forget how recent the explosion in three-point attempts has been. The chart below, which displays the percentage of all shot attempts that were threes, shows a gradual increase from 1998 to 2007. But from 2008 until 2012, the numbers leveled off, and it seemed peak-three had been reached. Then 2014 to 2018 happened, and the increase during that time period alone (8%) was greater than it was from all of 1998 to 2012 (7%)
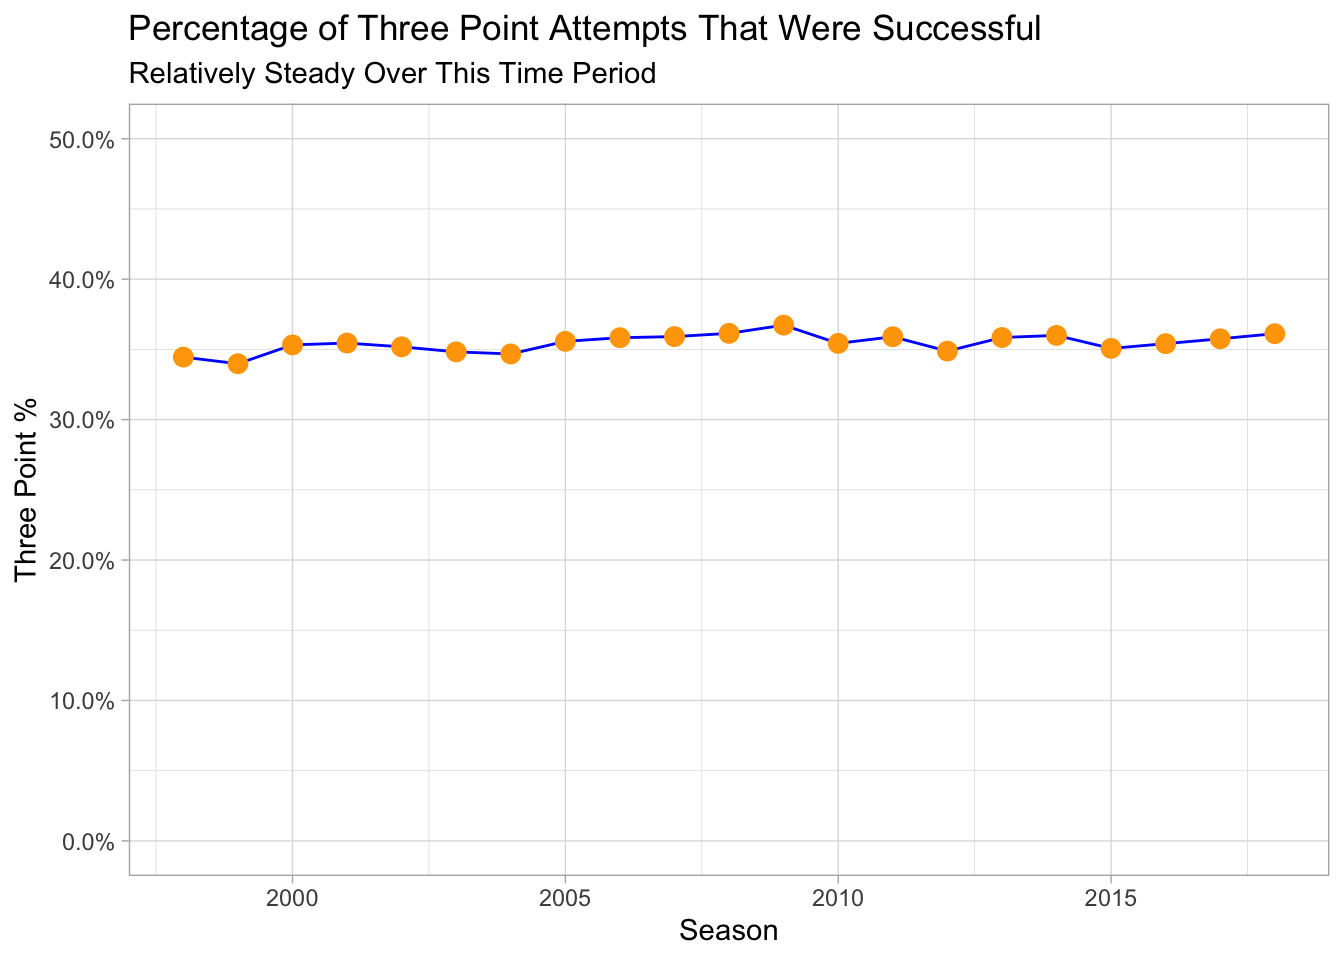
Although it’s a bit of an aside, despite the increase in the number of attempts, the percentage of three-pointers that have been made has remained relatively steady, as displayed below.
Distribution of Threes
As I mentioned above, three-point shots are no longer limited to certain positions, a point that is reflected in the histogram below. It shows players’ average number of three-point attempts per game along the x-axis, and the number of players falling within that range for the season is represented along the y-axis. Over time, notice how the distribution gets flatter. In 1998, the group who shot between zero and 0.5 threes per game appeared with the most frequency. But by 2018 that bar dropped significantly and the other bars lifted up. And pay attention to right side of the chart beginning in 2016.
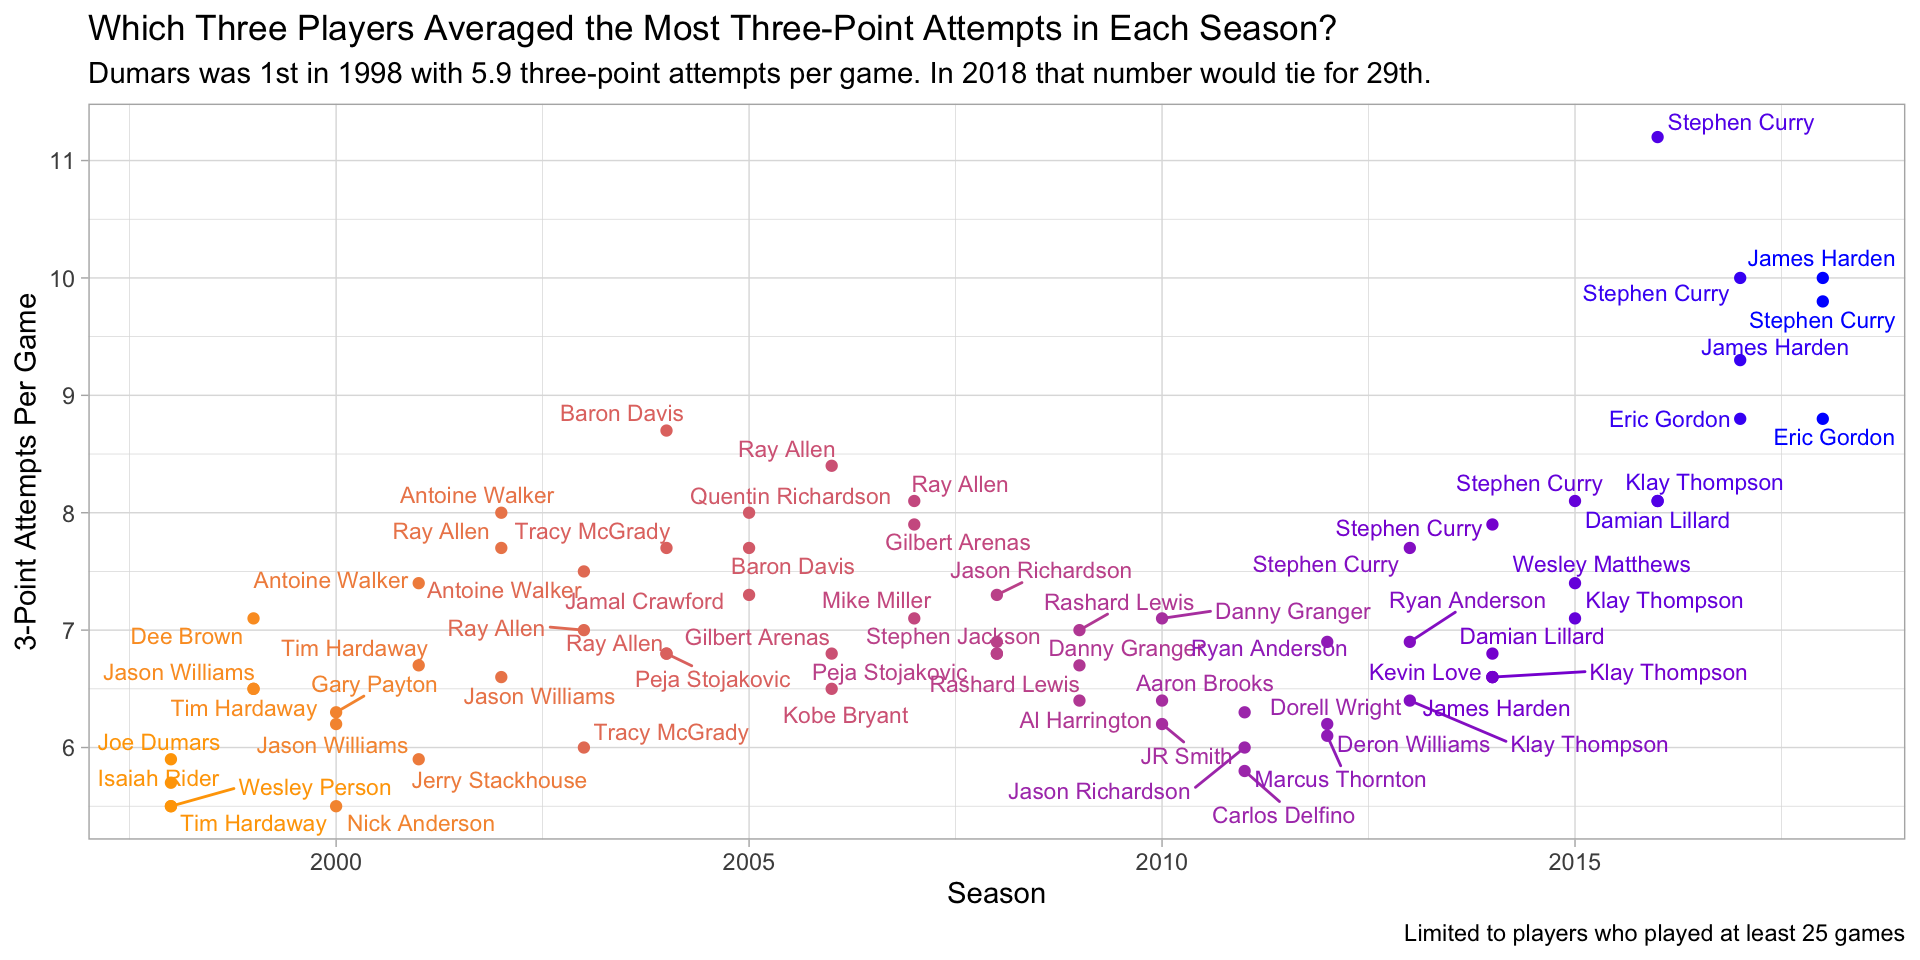
Top Attempters by Year
Who are these gunners that are changing how basketball is played? The chart below displays the three players who averaged the most threes per game for each season from 1998 to 2018. Even the casual fan will not be surprised by the more recent appearances on the chart: Splash-Brothers Curry and Thompson; and Gordon and Harden, whose GM is the aforementioned Daryl Morey.
Curry Explains it All
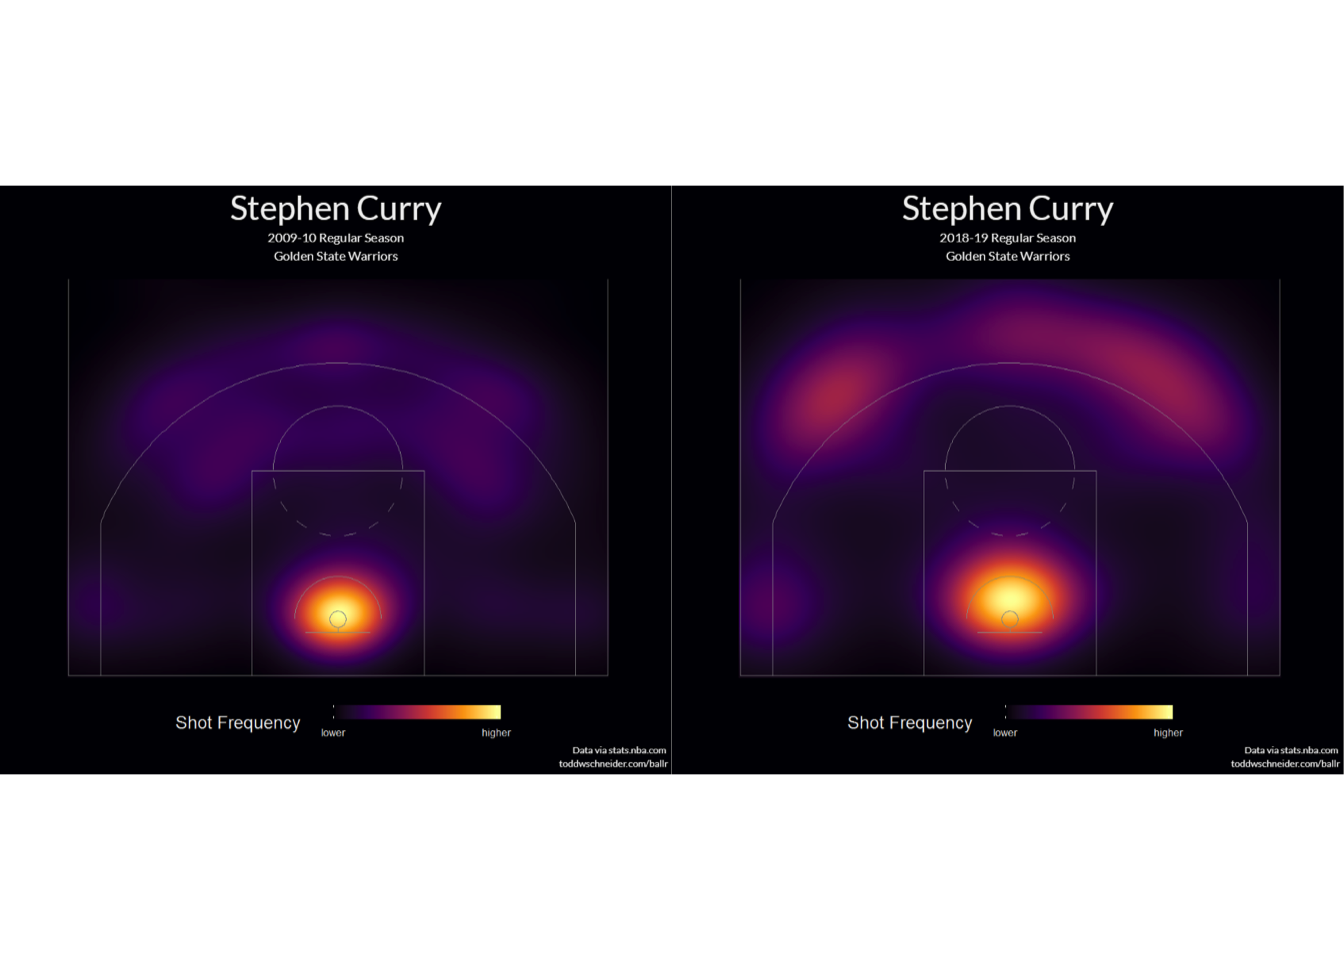
Daryl Morey’s influence on the game and the state of the evolution of the three-point shot is encapsulated by the shot charts below, which I downloaded using Todd Schneider’s ballr package. The chart on the left is Stephen Curry’s shot chart from his 2009-2010 rookie season, and the shot chart on the right is from his 2017-2018 season. It’s almost as if during that time the in-between game disappeared, leaving only three point shots and shots at the basket. That, folks, is modern basketball.
Conclusion
The new style of play is not for everyone. Like any trend, this one can’t go on forever, but I do wonder how far it can go until it reaches a breaking point. Maybe the breaking point comes from the league if they decide to move the line further back or establish a four-point line. Or maybe it comes from the next Daryl Morey who discovers an inefficiency in the way the game is currently played. Either way, enjoy the show, because there is nothing quite like watching Stephen Curry casually make game winning shots from close to half court!